Hertzsprung -
Russell
| H-R Diagram | Binary | Protostar | Brown Dwarf | White Dwarf | Red Giant | Variable Star | Neutron Star | Supergiants | Quasar |


You Should Know
Spectrum, Luminosity, H. N. Russell
∇ Ejnar Hertzsprung - many of the famous astronomers of the past started as amateurs, even Tycho Brahe and Copernicus were not "professionals" in the modern sense of the word. Olbers was a physician, Bessel was an apprentice to a commercial firm and Herschel was a musician. One of the last to become professor in astronomy and an observatory director without having attended a lecture in astronomy, was Ejnar Hertzsprung. Source Credit: Rundetaarn Website The oldest functioning observatory in Europe
∇ Henry Norris Russell - one of the most influential American astronomers during the first half of the 20th century. Henry Russell found that red stars fell into two main groups - giants and dwarfs, a discovery Danish astronomer Ejnar Hertzsprung had also made in 1906. As a result, a diagram mapping a star's brightness against its temperature was devised.
∇ Luminosity (L ) - a measure of the total amount of energy radiated by a star or other celestial object per second. This is therefore the power output of a star. Astronomers in practice also measure an object's luminosity in specific wavebands so that we can discuss an object's X-ray or visible luminosities for example. Reference: Australia Telescope Outreach and Education website
∇ Bolometric Luminosity - a star's power output across all wavelengths. [ ibid ]
∇ Spectrum - spectrum is just a fancy term for the different colors of light that are coming from a star. If you've ever shined light through a prism and seen the rainbow of colors that comes out the other end, then you've seen a spectrum.
∇ Angstrom - a unit of measure equal to one hundred-millionth of a centimeter. In everyday terms, a sheet of paper is approximately 1,000,000 angstroms thick. When dealing with spectral classification the ultraviolet portion of the spectrum covers from about 900 angstroms to about 3,000 angstroms whereas visible light covers the range from 4,000 to 8,000 angstroms.
The Diagram
What is it
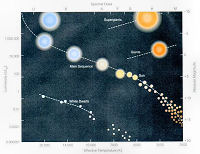
Image Credit: Orion's Arm Universe Project
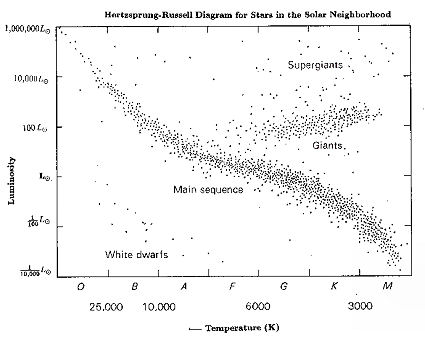
Stars are classified according to their measured spectrum and luminosity which is based on a standard template called the Hertzsprung-Russell Diagram or Chart (though there are several others which differ in form). In a Hertzsprung-Russell diagram, each star is represented by a dot and since there are lots of stars, there are lots of dots. The position of each dot on the diagram corresponds to the star's luminosity and its temperature - the vertical position represents the star's luminosity while the horizontal position represents the star's surface temperature.
Above is an image of the H-R chart which shows us the relationship between absolute magnitude, luminosity, classification, and effective temperature of stars. See: Wikipedia for a detailed explaination of the H-R Diagram.
Knowing the spectral type of a star tells the astronomer not only the temperature of the star, but also its luminosity (or absolute magnitude) and thereby, its color. This information, in turn, is used in determining the distance, mass, and other physical characteristics of a star, its surrounding environment, and its past history.
The H-R Diagram is really a powerful tool in astronomy. For example, when surveying and classifying stars, it is easier to compare or discern patterns or characteristics on a single plotted diagram then it would if thumbing through pages and pages of data. This is the strength of the H-R Diagram: large amounts of data can be easily placed on this plotting tool and the information quickly visulized. One such use is in stellar evolution or the physical changes a stars go through over time. Since a star's life is meansured in millions or billions of years, changes occur far too slowly for anyone to observe and record. We can, however, observe large groups of stars
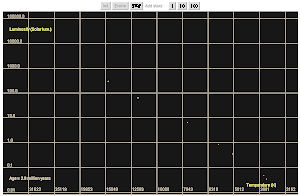
in various stages of stellar evolution, obtaining a clear picture of their development over the huge spans of time that they exist. Since it's always helpful to actually see what one is talking about, try clicking on the image below. This link opens in a separate window at the University of British Columbia where they have created an HR Diagram Simulator which allows you to place 1, 10 or 100 stars on the main sequence, then compare their evolution off the main sequence either in steps or as a movie.
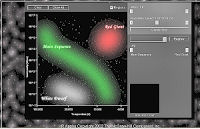
Here are a few more sites with simulators demostrating the use of the H-R Diagram. All are interactive and teach a diffrerent aspect of star plotting, the results which vary according to each simulator's goal. The simulator at the University of New Mexico is extremely well done, both visually and educationally, and is part of a larger lab program:
Stellar Evolution and the H-R- Diagram - from The McGraw-Hill Companies, Inc.
Astronomy Lab 101L, Education Lab Series - from the University of New Mexico Department of Physics & Astronomy.
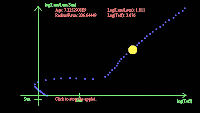
This applet visualizes a star's life cycle by following the evolution of the star's Age, Luminosity, Radius and Effective Temperature using a single plotting track - from the University of Durham, United Kingdom.
Where it Started
Historical Background
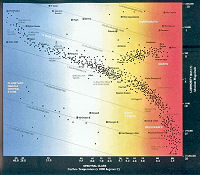
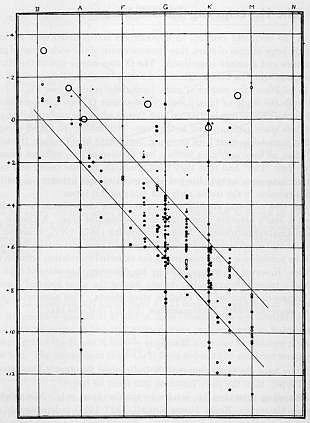
The work of Hertzsprung and Russell was first published in graphical form in 1911. Shown above is an early version of their diagram.
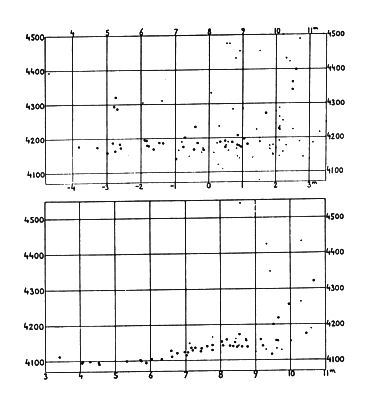
Seen above is Ejnar Hertzsprung's diagram from 1911 showing the Hyades at top and the Pleiades at the bottom. These graphs plot the effective wavelength of the light in Angstrom while the abscissa plots the visual & absolute magnitude values. Image Source: "Publikationen des Astrophysikalischen Observatorium zu Potsdam", 1911, Nr. 63.
At the same time Henry Russell, working at Princeton University, independently come to the same conclusion as Hertzsprung and in 1913 published his own star spectra & magnitude diagram. In the above chart, Russell listed the spectral types along the top and the absolute magnitudes on the left-hand side.
In our next section, we explain how a star's spectral data is obtained and how we determine it's classification type from that information.
For Historical Reading & Study
Ejnar Hertzsprung & Henry Norris Russell
∇ An illustrated chronology of innovations website
A searchable reference database with short entries of text and image content.
∇ University of Oklahoma
History of Science Exhibits Online website. Covering early astronomy to Newton.
∇ Astronomes Amateurs du Luxembourg
Amateur Astronomy website with images, links, information and a History of Individuals in Astronomy sections.
∇ History of Astronomy
Astronomiae Historia currently contains more than 400 astronomy related files. This site was created on behalf of the Working Group for the History of Astronomy in the stronomische Gesellschaf (in English & German).
∇ Ejnar Hertzsprung Bibliography
The Bruce Medalists online, Joseph S. Tenn, Sonoma State University
Quick Nav
∇ This Page
Hertzsprung-Russell Diagram
∇ Next Page
Spectra for Star Classification
∇ Back to
Star Page
∇ Back to
Main Page
This Page
Hertzsprung-Russell Diagram
Next Page
Spectra for Star Classification
Back to
Star Page
Back to
Back to Main Page
O, B, A, F, G, K, and M
Hertzsprung-Russell ordered their chart by assigning a letter representing a star's spectral class. To find out more just click the above link.
W, O, B, A, F, G, K, M, R, N, S
Wow! Oh, Be A Fine Girl/Guy, Kiss Me Right Now Sweetie! A new mnemonic. Wikipedia page explaining this Main sequence mnemonic.