Classification of Stars
| Spectral Classification | Binary | Protostar | Brown Dwarf | White Dwarf | Red Giant | Cepheids | Neutron Star | Supergiants |


∴ Photon-counting Spectrograph - an optical instrument that consists of an entrance slit, collimator, disperser, camera, and detector and that produces and records a spectrum. A spectrograph is used to extract a variety of information about the conditions that exist where light originates and along the paths of light.
∴ Rowland Circle - in spectroscopy, the Rowland Circle is a circle drawn tangent to the face of a concave diffraction grating at its midpoint, having a diameter equal to the radius of curvature of a grating surface; the slit and camera for the grating should lie on this circle. Reference source: Rowland circle. (n.d.). McGraw-Hill Dictionary of Scientific and Technical Terms. Retrieved November 24, 2008, from Answers.com Web site: The Rowland circle
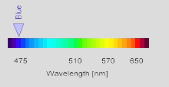
∴ Color Wavelength - these are the visible colors from shortest to longest wavelength in the order of violet, blue, green, yellow, orange, and red.
∴ Red-Shift - when the wavelength of the light is stretched, so the light is seen as 'shifted' towards the red (longer wavelength) part of the spectrum. The red shift of a distant galaxy or quasar is easily measured by comparing its spectrum with a reference laboratory spectrum. However, "astronomical redshifts are 'expansion redshifts' due to the expansion of space itself." see European Space Agency
∴ Doppler effect - a change in the observed frequency of a wave, as of sound or light, occurring when the source and observer are in motion relative to each other, with the frequency increasing when the source and observer approach each other and decreasing when they move apart. Reference: The American Heritage® Dictionary
∴ Absorption lines - a dark line in a spectrum. Produced by the absence of photons absorbed by atoms or molecules.
∴ Wien's law - Wien's Law tells us that objects of different temperature emit spectra that peak at different wavelengths.
Counting Photons
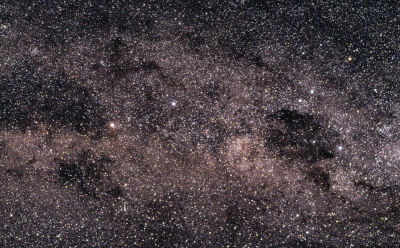
Alpha Centauri and the Southern Cross Image Credit: ESO
In order to determine a star's spectral classification we'll have to first choose a star or group of stars to survey and then request the services of a telescope equipped with a photon-counting spectrograph like the one shown below, an image of the NASA-funded Hopkins Ultraviolet Telescope. This particular telescope was sent aboard the space shuttle on two separate missions, in 1990 and 1995 (named ASTRO-1 & ASTRO-2 respectively) and was just one of three telescopes which comprised the Astro Observatory missions. This spectrograph is of the "Rowland circle" variety, named after the famous Hopkins physicist Henry Rowland and was used to obtain spectra data along the region of the far-UV spectrum.
Click to Enlarge Image, Credit: HUT Project Site
Now we'll need a star which to point our telescope at in order to collect a sample of it's light so, we'll use the star HD 66171, located at Ra: 08 08 10.5429 Dec: +71 55 27.950, as our example. Once the telescope is set to these coordinates, light from the star is collected in the form of photons and when enough have been sampled the completed data is sent and analyzed via a computer. The results are commonly displayed in one of two formats - a line graph of dips and spikes or a color spectrum image showing bands of light and dark absorption lines.
A Little Light Science
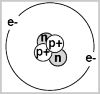 When we collect star light in order to study the results in the form of a "spectrum" what we are doing is looking at the very particles or atoms that make up the light wave itself. These light waves are actually waves of energy travelling through space at 186,000 miles per second. They are composed of atoms that contain electrons that have a natural orbit around the atom's nucleus. If the atom is energized it moves this electron to a higher orbit and whenever an electron that is in a higher-than-normal orbit falls back to its normal orbit it emits a photon or a small amount of energy with very specific characteristics - the photon has a frequency, or color, that exactly matches the distance the electron falls.
 Absorption is one way an electron can move (or jump) out of and back to it's normal orbit. How this works is simple - if we take the gas Helium and pass light through it on one side, some of the electrons within the atoms of light will move out of their natural orbits, a result of the interaction with the atoms of Helium. As the light is reemitted the electrons return to their natural state. When we measure this emitted light from the gas we will notice that there is less light within a certain wavelength, equating to that of Helium, than in the other wavelengths. When astronomers employ this method in their research, the resulting visual data, collected from the photons of light, is called an absorption spectrum. It is from this that one can determine the Composition, Temperature, Speed of approach or recession and other characteristics of a star.
 Stars and planets are normally surveyed and studied using a resulting photo image of dark absorption lines along a color spectrum, indicating the presence or absent of known elements. This process is used to determine a stars atmosphere, the gases composing a nebulae, the distance of a particular galaxy (red shifted) or the temperature of a star.
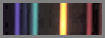
Below is an example of the visible light spectrum progressing from left to right, from long wavelength to short wavelength and from low frequency to high frequency light. The visible spectrum is roughly from 700 nm (red end) to 400 nm (violet end). FYI: The letter I in the mnemonic, Roy G. Biv is for indigo - no longer commonly used as a color name. It is included above strictly for the reason of making the sequence easier to say.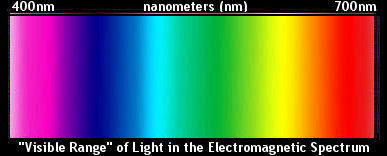
Blue is Hot, Red is Cool
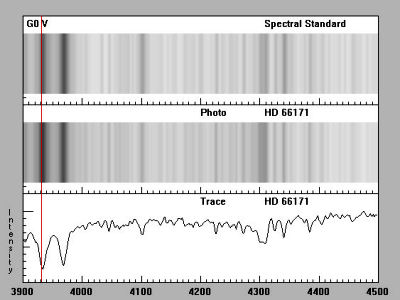
We can now begin the process of finding the spectral class of our star by looking at the dark bands called Absorption Lines in a photo-spectrum image or the "dips" and "spikes" in a graph-plotted format (see below) and comparing these to the spectrum of known types. In the below image we can see that HD 66171 has a similar spectral line to a type G0 V star. Remember, G is the Star's main spectral class on the H-R diagram [ fn 1 ] which means this star falls, like our sun, along the main sequence line on the H-R diagram.
Now that we have determined our star's main spectral class we can next look at it's temperature. First, we should know that O stars are the hottest with temperatures over 30,000 Kelvin and M stars are the coolest with temperatures under 3500 Kelvin. G stars like our Sun run in the range 5000-6000 Kelvin. In stellar classification there's a range of temperatures for each of the spectral classes and they are subdivided from hottest to coldest using the numerals 0-9. Thus, a G0 star is hotter than than a G2 star, and a G5 star is hotter than a G9 star. The next step is to establish our star's temperature and though this spectra classification section is based on templates of already established spectral types, it is helpful to understand how this is accomplished.
There are two methods we can use to ascertain a star's (surface) temperature:
1) By measuring its color using three filters that transmit light in three different wavelength ranges, then taking the ratio of the intensity of the light that gets through, for example, the shortest wavelength filter to the intensity of the light that gets throught the medium wavelength filter.
2) The other method is to look closely at the spectral lines in detail as these will indicate both something about a star's composition and more significantly, about it's temperature.
In the first instance above, the color emitted by a star is not sensitive to it's phyiscal makeup but it is sensitive to the temperature of the star. This is based on what is called blackbody radiation and in the stellar classification scheme the amount of radiation and it's distribution as a function of wavelength depends on the temperature of the star. This means that the hotter the star the more radiation and the shorter the (color) wavelength and so it goes that astronomers can measure the surface temperature of a star by measuring it's color.
In the second instance above, we can examine, in detail, the spectral lines like those in our spectra of star HD 66171. This method is based on how the atoms within elements behave under varying ranges of temperature and what effect this has on the lines of absorption. Let's say, for example, atoms in a made-up element called Allegorium ionize at extreme temperatures and so have a different energy level than the atoms of neutral Allegorium [ fn 2 ]. When we view the spectral data of a very hot star we see no absorption lines for neutral Allegorium atoms. On the other hand, when Allegorium is present on a cooler star it remains in it's ground state. When the spectral data of our cooler star is viewed we see the Allegorium shift from it's ground state to a higher (excited) state but we do not observe the absorption lines indicating shifts from one higher state to another.
HD 66171 is a G2V type star

go to...
∴This Page
Obtaining Star Spectra
∴Next Page
Actual Spectra
∴Back To
The Star Page
∴Back To
The Main Page
footnotes
fn.1
Return to source Paragraph
The absorption features present in stellar spectra allow us to divide stars into several spectral types depending on the temperature of the star. The scheme in use today is the Harvard spectral classification scheme which was developed at Harvard college observatory in the late 1800s, and refined to its present incarnation by Annie Jump Cannon for publication in 1924. Reference source: COSMOS - The SAO Encyclopedia of Astronomy Swinburne University of Technology.
fn.2
Return to source Paragraph
Atoms are neutral when they contain the same number of protons as electrons. Ionization is the physical process of converting an atom or molecule into an ion by adding or removing charged particles such as electrons or other ions. See Williams College for a study exercise entitled "Emission Lines and Central Star Temperature".
Obtaining Star Spectra
Actual Spectra
The Star Page
The Main Page
What Wavelength Goes With a Color? Atmospheric Science Data Center
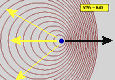
Applet: Doppler Effect Visualization of the Doppler effect. The LearningOnline Network with CAPA
Classification![]()
O-B-A-F-G-K-M To find out what all those letters mean click the pic (Wikipedia).