§ Stars
Page 2"We had the sky up there, all speckled with stars, and we used to lay on our backs and look up at them, and discuss about whether they was made or only just happened. Jim he allowed they was made, but I allowed they happened; I judged it would have took too long to make so many. Jim said the moon could a laid them; well, that looked kind of reasonable, so I didn't say nothing against it, because I've seen a frog lay most as many, so of course it could be done." - from the Adventures of Huckleberry Finn, Mark Twain
§ Contents
- You Should Know — Star Terminology & Information
In This Section You Should Know — Definitions from the Astronomical Science of Stars - Stars — Introduction
A Jeweled Pair — Albireo A & B - The Stellar Classification of Stars
The H-R Diagram — O, B, A, F, G, K, and M - History of the H-R Diagram
Amateur Astronomer: Ejnar Hertzsprung — Influential Astronomer: Henry Norris Russell - History of the H-R Diagram...continued
Amateur Astronomer: Ejnar Hertzsprung — Influential Astronomer: Henry Norris Russell - Evolution within an Evolving Universe
Evolution of the Universe & Universal Evolution — Stellar Evolution - Spectral Classification of Stars
Star HD 66171 — Spectral Classification, Counting Photons - The Luminosity Class
Luminosity class, A Star's Radius & Temperature — Apparent Magnitude - Sources & Further Study
Additional Resources - Star Types
Introduction to Star Types — Most of the Older Pages Displayed, Revisions in Progress
5. History of the H-R Diagram...continued
"Sharp-witted and animated by nervous energy, he became one of the most powerful voices in twentieth-century American astronomy, wielding that influence in calculated ways to redefine an entire science. He, more than any American of his generation, worked to turn an observation-centered discipline into a theory-driven pursuit centered on physics." — Princeton University Press, 2009
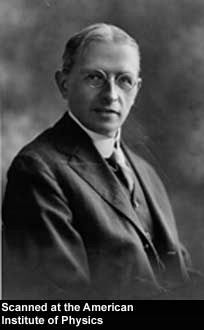
Henry Norris Russell
Dean of American Astronomers
 Born in Oyster Bay, New York, Henry Norris Russell began his academic studies in astronomy at Princeton University where he obtained his B.A. in 1897 and his doctorate degree in 1899 while working under the contemporary astronomer Charles A. Young who had encouraged Russell to think of the universe in evolutionary terms, to view it as a developing and continuing cycle of stellar life and death, looking further ahead, beyond any single cause for it's existence. In 1902, Russell travelled to Cambridge, England to study and from 1903 to 1905, worked at the Cambridge Observatory with Arthur Robert Hinks ( senior assistant there from 1903-1913 ) as a research assistant of the Carnegie Institution, coming under the influence of Sir George Darwin ( image right ) whose ideas and work had been at the heart of Young's eariler encouragment of Russell. fn1
Returning to Princeton in 1905, he was appointed an instructor in astronomy by Woodrow Wilson and in November of 1908 he married Lucy May Cole whom had four children. Their youngest child, daughter Margaret, eventually married the astronomer Frank K. Edmondson in the 1930's. Meanwhile, Russell was appointed as an assistant professor in 1908, attained a full professorship in 1911 and was appointed as a research professor in 1927, a position he maintained till 1947. He was also the director of the Princeton University Observatory from 1912 to 1947. Called the "Dean of American Astronomers" by many and known also as the "General" by colleagues Henry Norris Russell died in Princeton, New Jersey in 1957 at the age of 79. Image of Henry Norris Russell courtesy of the AIP Emilio Segre Visual Archives, W. F. Meggers Collection [14]
Prior to Hertzsprung and Russell, there existed a previous method of stellar classification called the "Secchi classes" ( Secchi, 1863—67 ) which was a method that grouped stellar spectra into four classes, depending on the absorption lines seen. However, this was superseded by the Harvard classification scheme in the late 1890s, and later improved upon by the H-R diagram in 1911-13 and the Yerkes spectral classification of 1943. Since that time, the only major revision to these diagrams were an extended spectral listing for newly discovered types of stars, a result of 20th century technological advancements. [15]
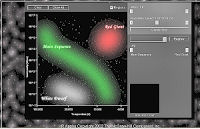
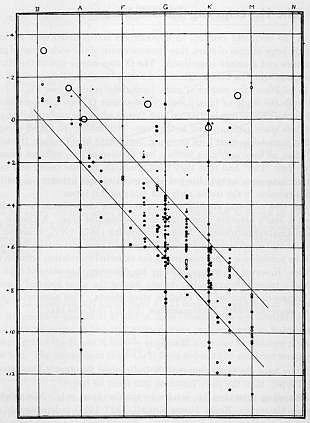 During the same period that Hertzprung was developing his chart, Henry Russell, working at Princeton University with a large amount of star data, independently come to the same conclusion as Hertzsprung and in 1913 published his own star spectra & magnitude diagram. On Russell's chart, shown at right, he listed the spectral types along the top and the absolute magnitudes on the left-hand side and what he found was that in a diagram of a stars' luminosity versus it's temperature, you get a nearly straight line, with the most luminous stars being the hottest and the least luminous, the coolest; the area on the chart where the largest group of stars fell along this line is called the main sequence. The development of the H—R diagram became a very powerful tool for astronomers as the grouping of a universe worth of stars into a managable scheme of classification was all but impossible due to sheer weight of numbers alone.
This was all fine and well, but as more and more groups of stars were placed on the chart, something else developed which was also inherent to the use of the H-R diagram. A small percentage of the stars in the chart began falling outside the main sequence. These were the stars that, as a result of the nature of their stellar evoluntion, were both very luminous yet much cooler, called Red Giants, like the star Betelgeuse, or those that conversely, proved to be really hot yet very dim, called White Dwarfs, like the star IK Pegasi B. These exceptions, like the white dwarf types, led astronomers over the years to develope general theories and conclusions, especially regarding the universe and it's age. Using an analogy, Terry D. Oswalt, professor of physics and space sciences at the Florida Institute of Technology noted:
"Think of a cup of coffee. When first poured, it is very hot, but as time goes on the temperature falls. If you know how fast a cup of coffee cools, you can measure its present temperature and determine how long it has been since it was poured. The color of a White Dwarf is easy to measure, and it directly tells us its temperature. The redder it is, the cooler it is--therefore the older it is."
"Curiously, we find no White Dwarfs cooler than about 4,000 Kelvins. It takes a White Dwarf about 10 billion years to cool to this temperature. So we conclude that even the first generation of stars in our galaxy, whose remnants are now White Dwarfs, have not had a chance to cool below 4,000 Kelvins. By that reckoning, the galaxy, and hence the whole universe, must be at least 10 billion years old." [16]
Eduacation and the H—R Diagram
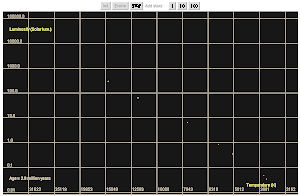 Since it's always helpful to get some hands on practice, try clicking on the image at left. This link opens in a separate window at the University of British Columbia where they have created an HR Diagram Simulator which allows you to place 1, 10 or 100 stars on the main sequence, allowing you to compare their evolution off the main sequence either in steps or as a movie. You will also find below, three more sites with simulators demostrating the use of the H-R Diagram. All are interactive and teach a diffrerent aspect of star plotting, the results which vary according to each simulator's goal. The simulator at the University of New Mexico is extremely well done, both visually and educationally, and is part of a larger lab program.
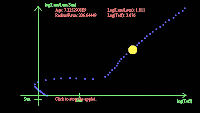
From left to right are 1) Stellar Evolution and the H-R- Diagram — from The McGraw-Hill Companies, Inc., 2) Astronomy Lab 101L, an education lab series applet from the University of New Mexico's Department of Physics & Astronomy and 3) University of Durham, United Kingdom, an applet that visualizes a star's life cycle by following the evolution of the star's Age, Luminosity, Radius and Effective Temperature using a single plotting track.
Universal Evolution
 Several browser searches later and the difference was crystal clear — that was, of course, after realizing the initial mistake in the order of the words submitted for the search engine to query. Says Wikipedia, Universal evolution is a theory of evolution formulated by Pierre Teilhard de Chardin and Julian Huxley that describes the gradual development of the Universe from subatomic particles to human society, considered by Teilhard as the last stage.
Evolution of the Universe
 Evolution of the Universe is ( generally speaking ) scientists peering into and surveying the universe, analyzing and exploring the workings of outer space, imaging the mulitutde of galaxies, taking spectrum of stars, researching the composition of stellar gases, matter, planets and yes, even the life and material which form this world we call Earth; it is the theory of how the universe itself came to be. Current scientific thinking has put forward three relevant theories in explaining the origin and evolution of the universe. Without delving into those at the moment, they are:
 "The Main Sequence is the location in the HR diagram
for stars in the first phase of their evolution, when they are fusing hydrogen in their cores."
Stellar Evolutionary Tracks in the HR Diagram, Dr. Christopher Palma
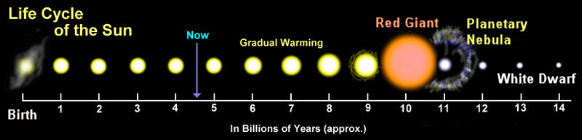 Stellar evolution is the process by which a star undergoes a sequence of radical changes during its lifetime. Depending on the mass of the star, this lifetime ranges from a few million years (for the most massive) to trillions of years (for the less massive), considerably more than the age of the universe. The image at left represents the stellar evolution of our own star, the sun.
Stellar evolution is not studied by observing the life of a single star: most stellar changes occur too slowly to be detected, even over many centuries. Instead, astrophysicists come to understand how stars evolve by observing numerous stars, each at a different point in its life, and by simulating stellar structure with computer models. Reference and image credit Stellar Evolution Wikipedia.
Stars, Near and Far
In the following sections, we will follow the beginning and end of a star's life, a journey across a billion or more years; a journey of complex and diverse variety, whose very numbers stagger the imagination. You will learn that the makeup of some stars are a result of their birth, some a product of their age, while others are the results of their physical makeup. Some are amazing in and of themselves and others due to the way they affect their stellar surroundings, even to the universe itself! Some have remained elusive while others have only recently been shown to exist. Some stars are stillborn while others end their lives in a mighty crescendo heard and seen across the universe, throwing out the stellar matter that comprises the very ingredients that make up our universe, galaxy, world and even ourselves.
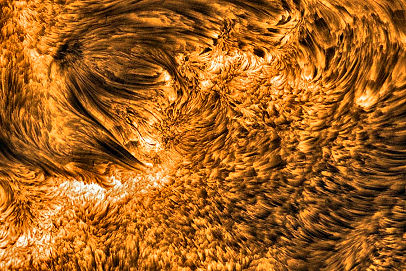
 Stars can be as near to us our own sun, a mere eight light-minutes away, a distance of about 93 million miles, or as far off as SN1997ff, a star that went supernova 11 billion light-years from Earth. At left is a close up of the surface of our own sun and it's solar flux tubes. It is one of the highest resolution images so far taken of the sun's surface. Image Credit: SST, Royal Swedish Academy of Sciences, LMSAL, as seen at the APOD website.
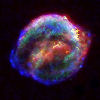
Seen at right and photographed about eight days after it exploded, Supernova 1997ff was discovered by astronomers comparing the northern Hubble Deep Field, a 10-day observation of a tiny region of sky first explored by the Hubble Space Telescope in 1995, the area receiving a follow-up observation in 1997. Image Credit: Adam Riess, STScI, NASA, NERSC, LBL Reference Source: SAO/NASA ADS Astronomy Query Form website and the Sol Station website.
Before we dicuss star types, it would be helpful to look at the process involved in obtaining the information needed when we determine the Spectral Classification of a star, as this will tell us much of what we need to know about each star type we review.
Dean of American Astronomers
Born in Oyster Bay, New York, Henry Norris Russell began his academic studies in astronomy at Princeton University where he obtained his B.A. in 1897 and his doctorate degree in 1899 while working under the contemporary astronomer Charles A. Young who had encouraged Russell to think of the universe in evolutionary terms, to view it as a developing and continuing cycle of stellar life and death, looking further ahead, beyond any single cause for it's existence. In 1902, Russell travelled to Cambridge, England to study and from 1903 to 1905, worked at the Cambridge Observatory with Arthur Robert Hinks ( senior assistant there from 1903-1913 ) as a research assistant of the Carnegie Institution, coming under the influence of Sir George Darwin ( image right ) whose ideas and work had been at the heart of Young's eariler encouragment of Russell. fn1Returning to Princeton in 1905, he was appointed an instructor in astronomy by Woodrow Wilson and in November of 1908 he married Lucy May Cole whom had four children. Their youngest child, daughter Margaret, eventually married the astronomer Frank K. Edmondson in the 1930's. Meanwhile, Russell was appointed as an assistant professor in 1908, attained a full professorship in 1911 and was appointed as a research professor in 1927, a position he maintained till 1947. He was also the director of the Princeton University Observatory from 1912 to 1947. Called the "Dean of American Astronomers" by many and known also as the "General" by colleagues Henry Norris Russell died in Princeton, New Jersey in 1957 at the age of 79. Image of Henry Norris Russell courtesy of the AIP Emilio Segre Visual Archives, W. F. Meggers Collection [14]
Prior to Hertzsprung and Russell, there existed a previous method of stellar classification called the "Secchi classes" ( Secchi, 1863—67 ) which was a method that grouped stellar spectra into four classes, depending on the absorption lines seen. However, this was superseded by the Harvard classification scheme in the late 1890s, and later improved upon by the H-R diagram in 1911-13 and the Yerkes spectral classification of 1943. Since that time, the only major revision to these diagrams were an extended spectral listing for newly discovered types of stars, a result of 20th century technological advancements. [15]
During the same period that Hertzprung was developing his chart, Henry Russell, working at Princeton University with a large amount of star data, independently come to the same conclusion as Hertzsprung and in 1913 published his own star spectra & magnitude diagram. On Russell's chart, shown at right, he listed the spectral types along the top and the absolute magnitudes on the left-hand side and what he found was that in a diagram of a stars' luminosity versus it's temperature, you get a nearly straight line, with the most luminous stars being the hottest and the least luminous, the coolest; the area on the chart where the largest group of stars fell along this line is called the main sequence. The development of the H—R diagram became a very powerful tool for astronomers as the grouping of a universe worth of stars into a managable scheme of classification was all but impossible due to sheer weight of numbers alone.This was all fine and well, but as more and more groups of stars were placed on the chart, something else developed which was also inherent to the use of the H-R diagram. A small percentage of the stars in the chart began falling outside the main sequence. These were the stars that, as a result of the nature of their stellar evoluntion, were both very luminous yet much cooler, called Red Giants, like the star Betelgeuse, or those that conversely, proved to be really hot yet very dim, called White Dwarfs, like the star IK Pegasi B. These exceptions, like the white dwarf types, led astronomers over the years to develope general theories and conclusions, especially regarding the universe and it's age. Using an analogy, Terry D. Oswalt, professor of physics and space sciences at the Florida Institute of Technology noted:
"Think of a cup of coffee. When first poured, it is very hot, but as time goes on the temperature falls. If you know how fast a cup of coffee cools, you can measure its present temperature and determine how long it has been since it was poured. The color of a White Dwarf is easy to measure, and it directly tells us its temperature. The redder it is, the cooler it is--therefore the older it is."
"Curiously, we find no White Dwarfs cooler than about 4,000 Kelvins. It takes a White Dwarf about 10 billion years to cool to this temperature. So we conclude that even the first generation of stars in our galaxy, whose remnants are now White Dwarfs, have not had a chance to cool below 4,000 Kelvins. By that reckoning, the galaxy, and hence the whole universe, must be at least 10 billion years old." [16]
Eduacation and the H—R Diagram
Since it's always helpful to get some hands on practice, try clicking on the image at left. This link opens in a separate window at the University of British Columbia where they have created an HR Diagram Simulator which allows you to place 1, 10 or 100 stars on the main sequence, allowing you to compare their evolution off the main sequence either in steps or as a movie. You will also find below, three more sites with simulators demostrating the use of the H-R Diagram. All are interactive and teach a diffrerent aspect of star plotting, the results which vary according to each simulator's goal. The simulator at the University of New Mexico is extremely well done, both visually and educationally, and is part of a larger lab program. From left to right are 1) Stellar Evolution and the H-R- Diagram — from The McGraw-Hill Companies, Inc., 2) Astronomy Lab 101L, an education lab series applet from the University of New Mexico's Department of Physics & Astronomy and 3) University of Durham, United Kingdom, an applet that visualizes a star's life cycle by following the evolution of the star's Age, Luminosity, Radius and Effective Temperature using a single plotting track.
6. Evolution within an Evolving Universe
Stellar Evolution
As is the case with many things in life, the words and terms we use can be more confusing than the science behind them. The world of astronomy — or 'Universe of' — is no exception, e.g., the name "Brown dwarfs" given to those wonderful orange-red colored stars or the terms Pre-planetary and Proto-planetary. In writing this section, a need to explain some differences in terminology arose which I set out here but briefly.Universal Evolution
Several browser searches later and the difference was crystal clear — that was, of course, after realizing the initial mistake in the order of the words submitted for the search engine to query. Says Wikipedia, Universal evolution is a theory of evolution formulated by Pierre Teilhard de Chardin and Julian Huxley that describes the gradual development of the Universe from subatomic particles to human society, considered by Teilhard as the last stage.Evolution of the Universe
Evolution of the Universe is ( generally speaking ) scientists peering into and surveying the universe, analyzing and exploring the workings of outer space, imaging the mulitutde of galaxies, taking spectrum of stars, researching the composition of stellar gases, matter, planets and yes, even the life and material which form this world we call Earth; it is the theory of how the universe itself came to be. Current scientific thinking has put forward three relevant theories in explaining the origin and evolution of the universe. Without delving into those at the moment, they are:- The Big Bang Theory
- The Steady State Theory
- The Pulsating Theory
"The Main Sequence is the location in the HR diagramfor stars in the first phase of their evolution, when they are fusing hydrogen in their cores."
Stellar Evolutionary Tracks in the HR Diagram, Dr. Christopher Palma
Stellar evolution is the process by which a star undergoes a sequence of radical changes during its lifetime. Depending on the mass of the star, this lifetime ranges from a few million years (for the most massive) to trillions of years (for the less massive), considerably more than the age of the universe. The image at left represents the stellar evolution of our own star, the sun.Stellar evolution is not studied by observing the life of a single star: most stellar changes occur too slowly to be detected, even over many centuries. Instead, astrophysicists come to understand how stars evolve by observing numerous stars, each at a different point in its life, and by simulating stellar structure with computer models. Reference and image credit Stellar Evolution Wikipedia.
Stars, Near and Far
In the following sections, we will follow the beginning and end of a star's life, a journey across a billion or more years; a journey of complex and diverse variety, whose very numbers stagger the imagination. You will learn that the makeup of some stars are a result of their birth, some a product of their age, while others are the results of their physical makeup. Some are amazing in and of themselves and others due to the way they affect their stellar surroundings, even to the universe itself! Some have remained elusive while others have only recently been shown to exist. Some stars are stillborn while others end their lives in a mighty crescendo heard and seen across the universe, throwing out the stellar matter that comprises the very ingredients that make up our universe, galaxy, world and even ourselves.
Stars can be as near to us our own sun, a mere eight light-minutes away, a distance of about 93 million miles, or as far off as SN1997ff, a star that went supernova 11 billion light-years from Earth. At left is a close up of the surface of our own sun and it's solar flux tubes. It is one of the highest resolution images so far taken of the sun's surface. Image Credit: SST, Royal Swedish Academy of Sciences, LMSAL, as seen at the APOD website.Seen at right and photographed about eight days after it exploded, Supernova 1997ff was discovered by astronomers comparing the northern Hubble Deep Field, a 10-day observation of a tiny region of sky first explored by the Hubble Space Telescope in 1995, the area receiving a follow-up observation in 1997. Image Credit: Adam Riess, STScI, NASA, NERSC, LBL Reference Source: SAO/NASA ADS Astronomy Query Form website and the Sol Station website.
Before we dicuss star types, it would be helpful to look at the process involved in obtaining the information needed when we determine the Spectral Classification of a star, as this will tell us much of what we need to know about each star type we review.
7. Spectral Classification of Stars
Spectral Classification, Counting Photons
In order to determine a star's spectral classification we'll have to first choose a star or group of stars to survey and then request the services of a telescope equipped with a photon-counting spectrograph like the one shown above right, a diagram of the NASA-funded Hopkins Ultraviolet Telescope. This particular telescope was sent aboard the space shuttle on two separate missions, in 1990 and 1995 (named ASTRO-1 & ASTRO-2 respectively) and was just one of three telescopes which comprised the Astro Observatory missions. This spectrograph is of the "Rowland circle" variety, named after the famous Hopkins physicist Henry Rowland and was used to obtain spectra data along the region of the far-UV spectrum. Image left: Alpha Centauri and the Southern Cross from the European Organisation for Astronomical Research in the Southern Hemisphere.
 Now we'll need a star which to point our telescope at in order to collect a sample of it's light.
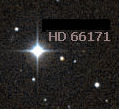
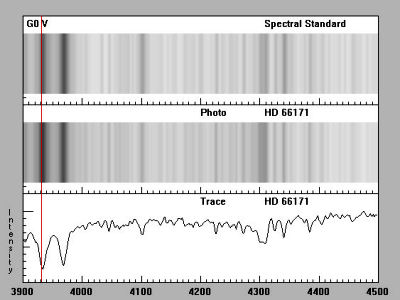
 Therefore, we'll use the star HD 66171, located at Ra: 08 08 10.5429 Dec: +71 55 27.950, as our example. Once the telescope is set, the viewing mirror focused at these coordinates, light from the star is collected in the form of photons and when enough have been sampled the completed data is sent and analyzed via a computer. The results are commonly displayed in one of two formats - a line graph of dips and spikes or a color spectrum image showing bands of light and dark absorption lines in either black and white or color, seen above right.
A Little Light Science
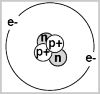 When we collect star light in order to study the results in the form of a "spectrum" what we are doing is looking at the very particles or atoms that make up the light wave itself. These light waves are actually waves of energy travelling through space at 186,000 miles per second. They are composed of atoms that contain electrons that have a natural orbit around the atom's nucleus. If the atom is energized it moves this electron to a higher orbit and whenever an electron that is in a higher-than-normal orbit falls back to its normal orbit it emits a photon or a small amount of energy with very specific characteristics - the photon has a frequency, or color, that exactly matches the distance the electron falls.
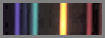 Absorption is one way an electron can move (or jump) out of and back to it's normal orbit. How this works is simple - if we take the gas Helium and pass light through it on one side, some of the electrons within the atoms of light will move out of their natural orbits, a result of the interaction with the atoms of Helium. As the light is reemitted the electrons return to their natural state. When we measure this emitted light from the gas we will notice that there is less light within a certain wavelength, equating to that of Helium, than in the other wavelengths. When astronomers employ this method in their research, the resulting visual data, collected from the photons of light, is called an absorption spectrum. It is from this that one can determine the Composition, Temperature, Speed of approach, recession and other characteristics of a star.
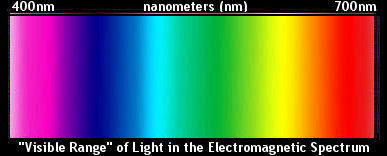 At left is an example of the visible light spectrum ( the range of light within the electromagnetic radiation spectrum that we can see ), arranged in order of the wavelengths of each color, with Violet at 380-450 nm (380-450 Trillion Hz) to Red, at 620-750 nm (620-750 Trillion Hz) with the edges of the visible light spectrum blending into the ultraviolet or infrared levels of radiation.
Our Spectral Classification
With this information in hand we can now begin the process of finding the spectral class of our star, from the previously obtained spectrographic data, by looking at the dark bands called Absorption Lines in a photo-spectrum image or the "dips" and "spikes" in a graph-plotted format (see below) and comparing these to the spectrum of known types; a process also known as spectrometry. In the image below we can see that HD 66171 has a similar spectral line to a type G0 V star. Remember, G is the Star's main spectral class on the H-R diagram which means this star falls, like our sun, along the main sequence line on the H-R diagram. fn2
 Now that we have determined our star's main spectral class, we can next look at it's temperature. First, we should know that O stars are the hottest, with temperatures over 30,000 Kelvin and M stars are the coolest, with temperatures under 3500 Kelvin. G stars, like our Sun, run in the range 5000-6000 Kelvin. In stellar classification there's a range of temperatures for each of the spectral classes and they are subdivided from hottest to coldest using the numerals 0-9. Thus, a G0 star is hotter than than a G2 star, and a G5 star is hotter than a G9 star. The next step is to establish our star's temperature and though our classification section is based on templates of already established spectral types, it is helpful to understand how this is accomplished. Note: 1 degree Kelvin equals exactly 1.8 degrees Fahrenheit.
There are two methods we can use to ascertain a star's (surface) temperature:
1) By measuring its color using three filters that transmit light in three different wavelength ranges, then taking the ratio of the intensity of the light that gets through, for example, the shortest wavelength filter to the intensity of the light that gets throught the medium wavelength filter.
2) The other method is to look closely at the spectral lines in detail as these will indicate both something about a star's composition and more significantly, about it's temperature.
In the first instance, the color emitted by a star is not sensitive to it's phyiscal makeup but it is sensitive to the temperature of the star. This is based on what is called blackbody radiation and in the stellar classification scheme the amount of radiation and it's distribution as a function of wavelength depends on the temperature of the star. This means that the hotter the star the more radiation and the shorter the (color) wavelength and so it goes that astronomers can measure the surface temperature of a star by measuring it's color.
In the second instance above, we can examine, in detail, the spectral lines like those in our spectra of star HD 66171. This method is based on how the atoms within elements behave under varying ranges of temperature and what effect this has on the lines of absorption. Let's say, for example, atoms in a made-up element called Allegorium ionize at extreme temperatures and so have a different energy level than the atoms of neutral Allegorium. When we view the spectral data of a very hot star we see no absorption lines for neutral Allegorium atoms. On the other hand, when Allegorium is present on a cooler star it remains in it's ground state. When the spectral data of our cooler star is viewed we see the Allegorium shift from it's ground state to a higher (excited) state but we do not observe the absorption lines indicating shifts from one higher state to another. fn3
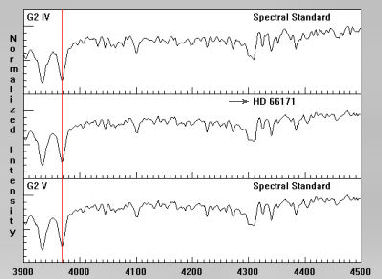
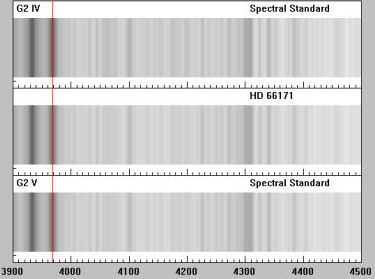
By comparing the spectral data we obtained for our star with that of stars in the G_V type category, we find a match for HD 66171 - a type G2 V. Shown above are the graph plot and photo spectrum identfying the classification type of our star. The red vertical line in the image is part of the software program used for this demostration. It is used to isolate the areas of absorption which in turn defines the element which is apparent in the spectral data. In this case the postion of the line at this measured point indicates the presence of Ca (II) or Calcium, an element seen strongest amongst type G8-K2 stars.
It should be noted that both neutral hydrogen and ionized calcium have lines very near 3970. If this line and the calcium line at 3933 are about the same strength, you can assume that the line at 3969-70 is from calcium. If the line at 3933 is much weaker, then you can assume that the line at 3969-70 is from hydrogen.
In our next section, we'll finish are topic on the spectral classification of stars with a review of the Luminosity Classification. The section then concludes with a review of actual spectral examples from surveys conducted on stars and other stellar objects.
Acknowledgement
I wish to acknowledge the fine efforts of the physics staff at Gettysburg College who have written a variety of educational astronomy software packages and to whom credit for the above images of the spectural "photo" and "graph" charts must go. Project CLEA is funded by grants from the National Science Foundation under the Division of Undergraduate Education in the program of Course and Curriculum Development, and by Gettysburg College. The intention of Project CLEA is to produce innovative teaching tools and other materials for use in an educational environment and to make this material available to astronomy educators.
Footnotes
1. Charles A. Young noted that the work of Sir George Darwin had "opened a new field of research" for astronomers, leading to a new method of organizing it's resultant data. Under this new thought regarding "universal evolution", 19th and early 20th century astronomers began to develope the concept of a continuous cycle of life and death within the cosmos and applied this thinking to the stellar evolution of stars. While the theories of evolution under the title "Darwinism" may have been the earlier protege of this thinking, the concept itself took on it's own form and theories at this point, brought on by Sir George Darwin and directly and indirectly continued in the work of astronomers like Charles A. Young, Norman Lockyer, George Ellery Hale, Henry Norris Russell and finally, gaining it's greatest proponent in the form of Harvard College Observatory director Harlow Shapley. It is to these early astronomers, whom "appropriated Darwinism as a symbol and as an organizing principle" that we owe our current scientific thought regarding the theories and ideas of stellar evolution. See the essay Evolution A Starry Archetype by Dr. David DeVorkin. Published by the The National Science Foundation website, Mar 09, 2009
2. "The absorption features present in stellar spectra allow us to divide stars into several spectral types depending on the temperature of the star. The scheme in use today is the Harvard spectral classification scheme which was developed at Harvard college observatory in the late 1800s, and refined to its present incarnation by Annie Jump Cannon for publication in 1924." Reference source: COSMOS - The SAO Encyclopedia of Astronomy Swinburne University of Technology.
3. Atoms are neutral when they contain the same number of protons as electrons. Ionization is the physical process of converting an atom or molecule into an ion by adding or removing charged particles such as electrons or other ions. See Williams College for a study exercise entitled "Emission Lines and Central Star Temperature".